I can’t believe it’s already Month 10 since I acquired and started Sites 1, 2, and 3!
Time’s flying and the One Year Anniversary will be here in a couple months. Excited to see where the sites are after 12 months.
For now, let’s see what March brought.
March Total Revenue of $5,230.70
14.7% Increase from February
After 3 months of declines in total revenue from December to February, this is the first month-to-month increase in earnings. I wasn’t quite sure when, if, things would start turning around, but I’m glad the streak has finally broken.
Buying seasons November and December both had high traffic and revenue that will be tough to match until the end of 2021. With the sites containing majority commercial articles, they all worked well during buying seasons, but not so much in January and February.
What I did to combat the low seasons was to write more informational articles to help replace some of the traffic that was lost due to the early months having less traffic to commercial articles.
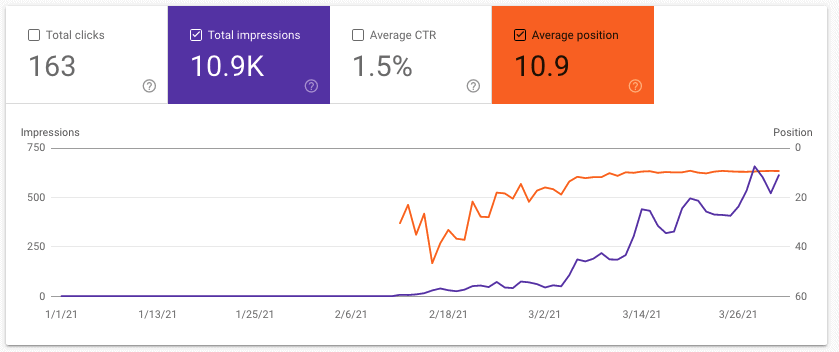
Here’s an example of one of the better informational articles published Feb. 10th. After 1.5 months, it’s getting ~600 search impressions and ~10 clicks a day. In the next month or two, I’d expect the position ranking to move up, an increase in CTR, and more traffic.
Well-written commercial articles will still give you much better ARPU, EPMV, RPM, whatever metric you want to calculate your ROI, but it doesn’t have the high, flashy pageview numbers.
Depending on the products, the articles won’t have the longevity of an informational article. If products are upgraded every year, you’ll probably need to update the articles once a year or create new ones, e.g. review of new product model.
The plus is the ARPU will be higher and I’m all about trying to maximize the revenue for each visitor. Google might have other plans, so just have to go with whatever updates they have.
That’s my thinking anyways, it’ll be interesting to see whether that holds up over time. I’ll have to go through my data to see how far back I can go with the info articles I do have.
Monthly Profit & Loss Overview – March 2021
Here are the traffic and P&L stats of the 3 main case study sites.
| Site 1 | Site 2 | Site 3 | TOTAL | |
|---|---|---|---|---|
| Sessions | 26,050 | 9,719 | 715 | 36,484 |
| Pageviews | 28,227 | 11,175 | 951 | 40,353 |
| Amazon Associates Earnings | $1,995.39 | $1,867.73 | $62.86 | $3,925.98 |
| Ezoic Earnings | $1,079.91 | $194.14 | $16.80 | $1,290.85 |
| Other Earnings | N/A | N/A | $14.00 | $14.00 |
| Total Revenue | $3,075.30 | $2,061.84 | $93.66 | $5,230.83 |
| Expenses | $493.74 | $79.67 | $8.85 | $582.26 |
| Profit / Loss | $2,581.56 | $1,982.20 | $84.81 | $4,648.57 |
| ARPU | $0.118 | $0.212 | $0.131 | $0.154 (Avg) |
The Total Revenue increased for each site, but what I’m more encouraged by is the increased ARPU for each site. With an average revenue of $0.154 per User, that’s an average RPM of $154 across the 3 sites.
Site 1 – Recap And Income Report Breakdown
| SITE 1 | SESSIONS | REVENUE | EXPENSES | P&L | ARPU |
|---|---|---|---|---|---|
| June 2020 | 1,078 | $8.49 | $2,187.25 | ($2,178.76) | $0.008 |
| July 2020 | 1,086 | $57.08 | $807.99 | ($750.91) | $0.053 |
| August 2020 | 1,559 | $169.67 | $276.55 | ($106.88) | $0.109 |
| September 2020 | 2,984 | $132.68 | $943.40 | ($810.72) | $0.044 |
| October 2020 | 12,431 | $1,204.38 | $970.60 | $233.78 | $0.097 |
| November 2020 | 65,622 | $8,600.72 | $1,451.26 | $7,149.46 | $0.131 |
| December 2020 | 51,080 | $6,801.72 | $902.50 | $5,899.22 | $0.133 |
| January 2021 | 32,750 | $3,857.05 | $1,265.87 | $2,591.18 | $0.118 |
| February 2021 | 27,279 | $2,708.62 | $242.63 | $2,465.99 | $0.099 |
| March 2021 | 26,050 | $3,075.30 | $493.74 | $2,581.56 | $0.118 |
Traffic sessions are down from Feb., but revenue is up. Total earnings of $3,075.20 are from both affiliate commissions and display ads.
- $1,995.39 – Amazon Affiliate Earnings (US & International)
- $1,079.81 – Ezoic Earnings
I’m not happy with the lower traffic, but at least ARPU increased due to the affiliate sales picked up. Let’s get into the details.
Site 1 Google Analytics Traffic
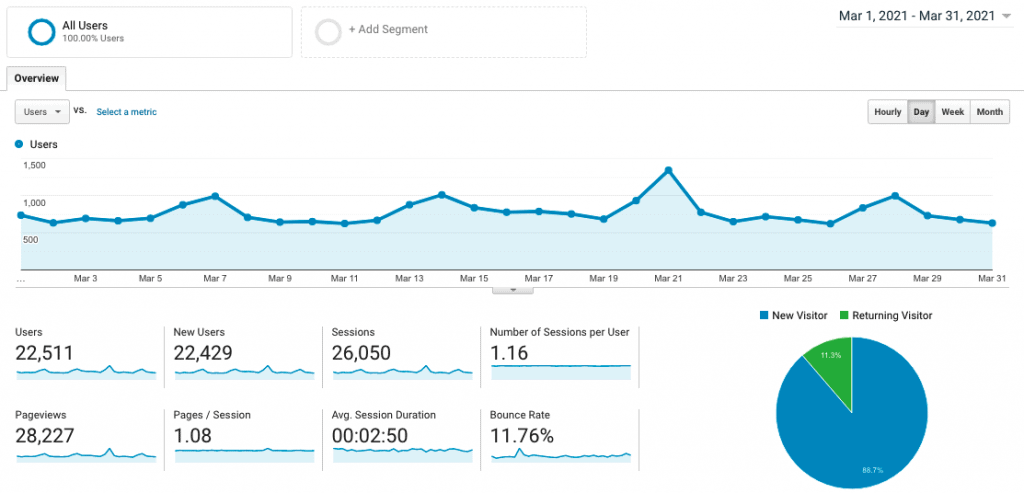
Drop in traffic this month. I dug into it a bit and saw less traffic going to a few product review pages. On the plus side, the info articles like the one mentioned earlier, is making up a little for some of that lost traffic.
I’ve been focussing on the getting more articles published, but will put some time on scheduling a batch of social media posts. I’ll usually just batch schedule a bunch of social media posts every 1-2 months. I haven’t put in any work on optimizing social media, but that’s something I do want to do. I use Publer to create and schedule posts.
I’m hoping the informational posts I’ve been publishing will continue to increase traffic.
Site 1 Amazon Affiliate Earnings
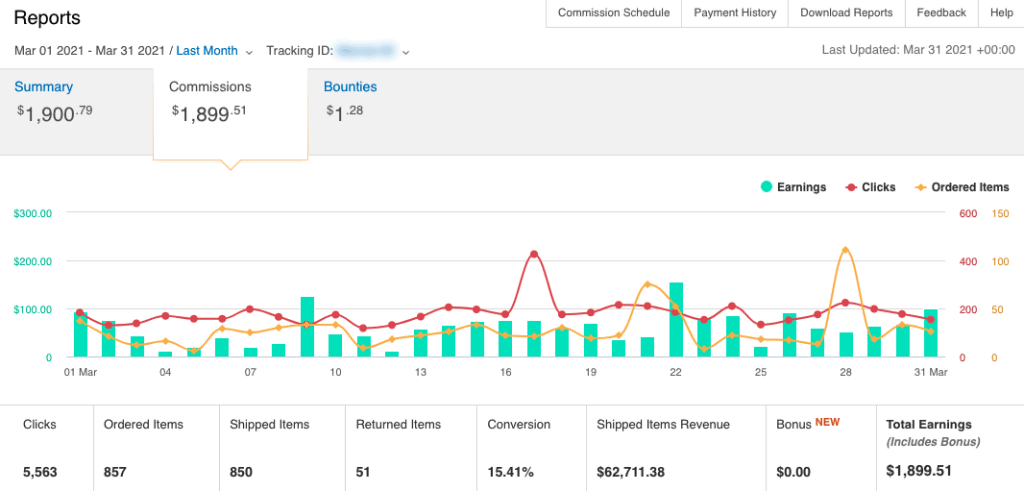
Amazon sales came back to beat Jan. and Feb. sales: $1900.79 in US Amazon Affiliate earnings and $94.60 from International Amazon.
Here are some of the Amazon metrics to help tell the story:
| DEC | JAN | FEB | MAR | |
| Sessions | 51,080 | 32,750 | 27,279 | 26,050 |
| CTR to Amazon | 18.98% | 20.44% | 23.68% | 21.36% |
| Order Conversion % | 14.09% | 12.21% | 10.71% | 15.41% |
| Shipped Rev per Click | $12.74 | $8.60 | $6.46 | $11.27 |
| Return % | 5.40% | 10.37% | 6.65% | 6.00% |
| Avg. Price per Ship. Item | $78.43 | $67.78 | $64.48 | $73.78 |
People started to buy again in March. It could be due to the stimulus checks many people received and the the economy trying to get back on track.
Looking at the Order Conversion %, that shows more people are buying. For every 100 people who click through to Amazon, 15 people purchase something. It’s higher than even December during the holiday seasons. I wouldn’t have expected that.
Avg. Price per Shipped Item tells me that people were buying larger ticket items again.
Affiliate sales will always be up and down due to seasonality and what’s going on in the world.
Site 1 Ezoic Earnings
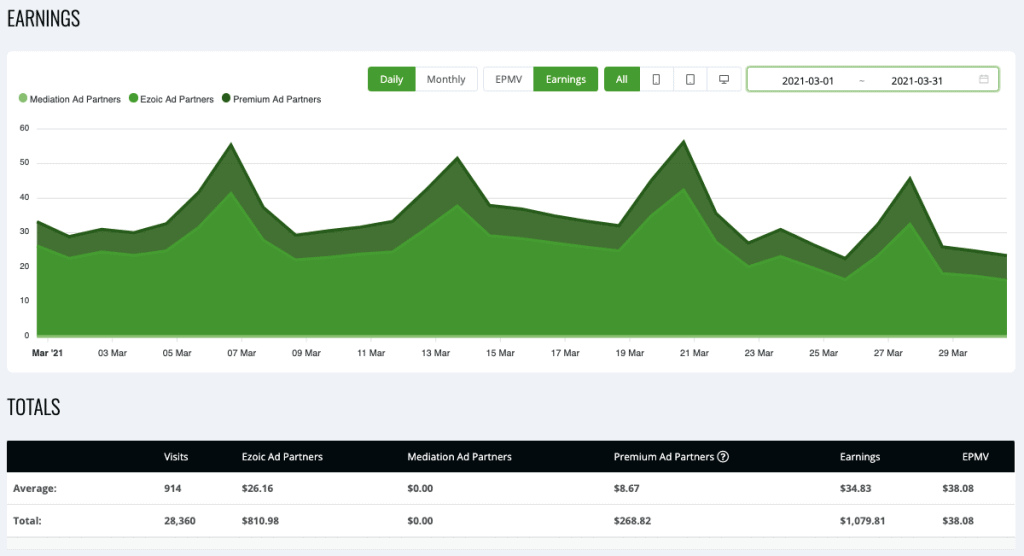
With the end of Q1, ad revenues have dropped significantly. March earned $1,079.81 and EPMV is only $38.08. February EPMV was $44.28.
Not surprising as traffic was lower and that coincided with less ad spending for my niche. As I get more traffic to informational posts, the EPMV will also drop. EPMV is always going to be higher for buyer-intent pages, at least for this site.
From previous months, it also seems to be that higher traffic would result in increased EPMV. I think it could be that Ezoic’s AI is able to better optimize revenues for pages the more traffic it has.
Site 1 Expenses
Expenses for Site 1 was $493.74. with the majority coming from Ezoic Premium costs, links, and content writing.
Site 1 Plan for April
I’m writing this from the future, because Site 1’s been nudged by the Google Product Reviews Update on April 8th. So I’m going to spend the next couple months updating the 150+ posts. Not all posts were hit, but why not spend the time to update them anyways.
Site 2 – Recap And Income Report Breakdown
Here are Site 2’s visitor traffic, earnings, costs, and profits.
| SITE 2 | SESSIONS | REVENUE | EXPENSES | P&L | ARPU |
|---|---|---|---|---|---|
| June 2020 | 229 | $14.97 | $564.00 | ($549.03) | $0.065 |
| July 2020 | 282 | $12.58 | $22.00 | ($9.42) | $0.045 |
| August 2020 | 571 | $48.61 | $13.56 | $35.05 | $0.085 |
| September 2020 | 936 | $156.00 | $74.00 | $82.00 | $0.167 |
| October 2020 | 2,688 | $709.88 | $155.60 | $554.28 | $0.264 |
| November 2020 | 9,373 | $2,037.53 | $402.41 | $1,635.12 | $0.217 |
| December 2020 | 16,803 | $4,199.67 | $95.50 | $4,104.17 | $0.250 |
| January 2021 | 14,862 | $2,617.94 | $470.06 | $2,147.88 | $0.176 |
| February 2021 | 9,658 | $1,825.85 | $130.23 | $1,695.62 | $0.189 |
| March 2021 | 9,719 | $2,061.87 | $79.67 | $1,982.20 | $0.212 |
Site 2 Google Analytics Traffic
Looks like Site 2’s settling in around 9-10k user sessions per month. Many of the key articles are already in the Top 1-3 positions.
There is one key article that’s usually around Position 6-7, so that can be improved, but it’s going to take a lot of authority and backlinks to beat the big boys.
Here’s the traffic. There was one day with an overeager traffic bot that hit many sites. Many people in the various Facebook groups and forums I watch were talking about bot traffic that week.
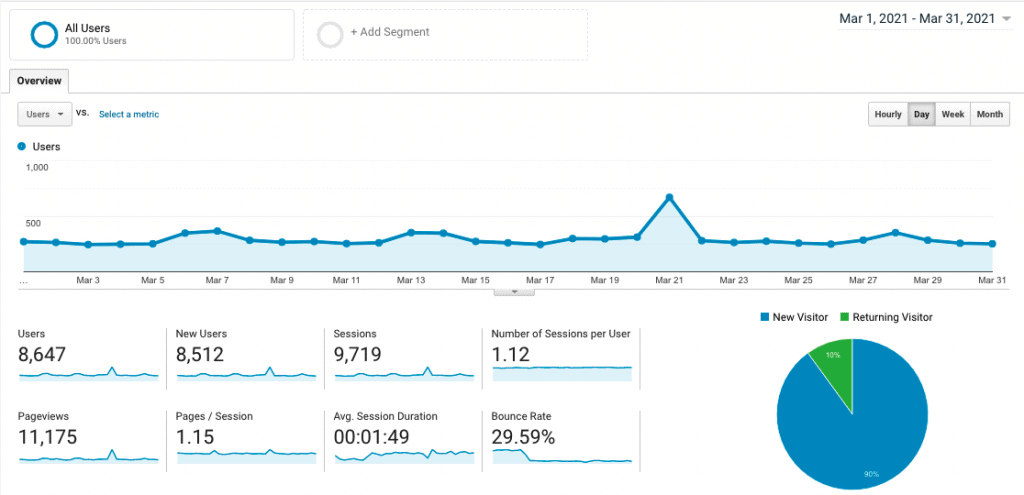
I think I’ve reached a “saturation” point with the buyer-intent articles. The informational ones are up and down. To get the informational ones out there more, I’m going to need to update them and do more social media posts for them, especially Pinterest.
Site 2 Amazon Affiliate Earnings
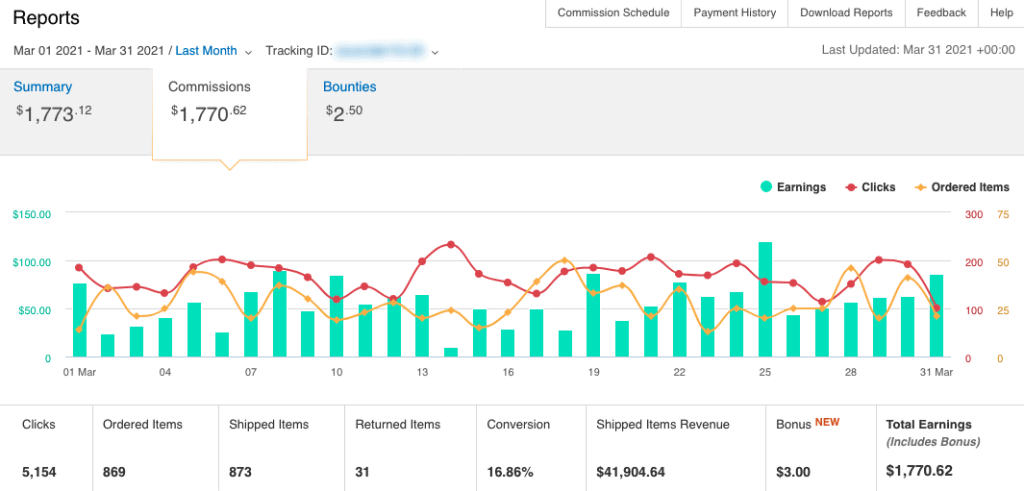
$1,773.12 from Amazon Associates in March. Over $200 more than February.
One interesting thing to note is click-thru rate from Site 2 to Amazon was the lowest it’s been with only 53.03% of visitors going to Amazon. That’s probably due to an uptick on traffic to the informational articles I put up in the last few months, because there’re no Amazon links on those articles.
Here are the Conversion Rates for the last 6 months. Left percentage is the Conversion Rate of Purchases from people who click-thru to Amazon. The Right percentage is the Visitors who click-thru to Amazon from the site.
- Oct 2020: 15.67% and 71.47%
- Nov 2020: 17.61% and 73.37%
- Dec 2020: 18.72% and 70.06%
- Jan 2021: 13.80% and 64.78%
- Feb 2021: 18.64% and 61.72%
- Mar 2021: 16.86% and 53.03%
Site 2 Ezoic Earnings
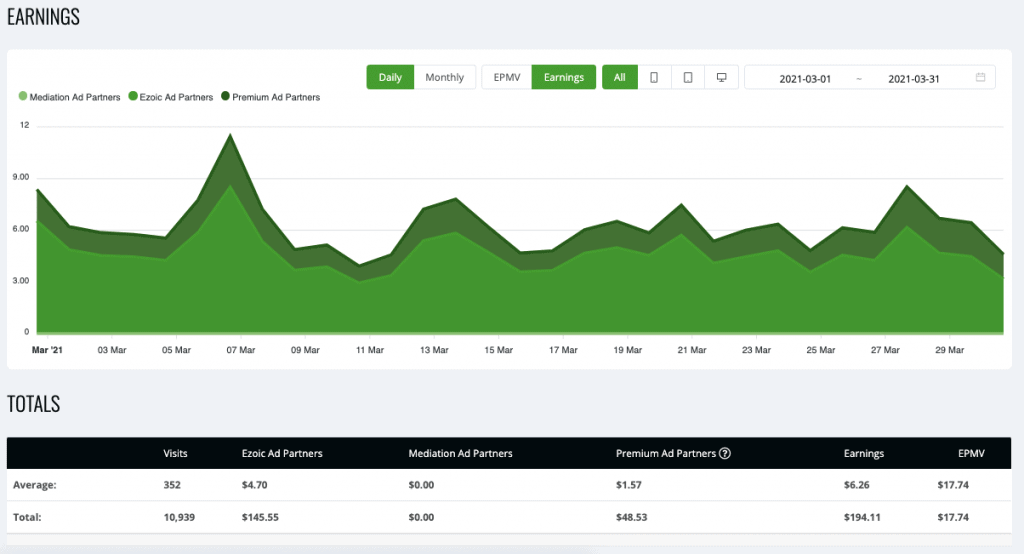
$194.11 in Ezoic Ad earnings with an EPMV of $17.74. Not much to write here as EPMV has been steady around the high teens for months now.
I’d love to increase earnings here, but it’ll require more traffic and content. Making plans for all that.
Site 2 Expenses
$79.67 in expenses were essentially for Ezoic costs and a link. I might start ramping up more content here, so expenses will go up. I also may just write them myself, because I haven’t found a good, knowledgeable writer for this niche yet. I always end up taking a good amount of time to edit.
Site 2 Plan For March
Always planning to add more content, but things always come up. Still planning to add more content to this site.
I’ve been toying with the idea of expanding outside of the micro-niche it’s in with a shoulder niche.
Site 3 – Recap And Income Report Breakdown
The numbers for Site 3, no major jumps or declines.
| SITE 3 | SESSIONS | REVENUE | EXPENSES | P&L | ARPU |
|---|---|---|---|---|---|
| June 2020 | 95 | $0 | $5.00 | ($456.00) | $0 |
| July 2020 | 309 | $0 | $22.00 | ($22.00) | $0 |
| August 2020 | 203 | $12.41 | $5.00 | $7.41 | $0.061 |
| September 2020 | 250 | $8.24 | $31.00 | ($22.76) | $0.033 |
| October 2020 | 355 | $37.31 | $31.00 | $6.31 | $0.105 |
| November 2020 | 498 | $100.72 | $65.00 | $35.72 | $0.202 |
| December 2020 | 655 | $71.82 | $66.00 | $5.82 | $0.110 |
| January 2021 | 686 | $106.54 | $69.16 | $37.38 | $0.155 |
| February 2021 | 512 | $25.00 | $7.55 | $17.45 | $0.049 |
| March 2021 | 715 | $93.66 | $8.85 | $84.81 | $0.131 |
Site 3 has been pretty much stagnant. I’m not quite sure what to make of it really after 10 months.
I’ve run through the usual competition, keywords, and content. The content does need an optimization refresh, so I have that one high up on my To-Do list.
There are a few articles that’re moving up slowly, but surely. Three articles are in the Top 10 for its main keywords, so that’s where the majority of traffic is coming from.
One thing I’ve been wondering is if it’s the expired domain redirect I had with all the spammy backlinks. So at the end of March, I broke off that redirect.
I’m keeping track of how the site is affected on seotesting.com.
Site 3 Google Analytics Traffic
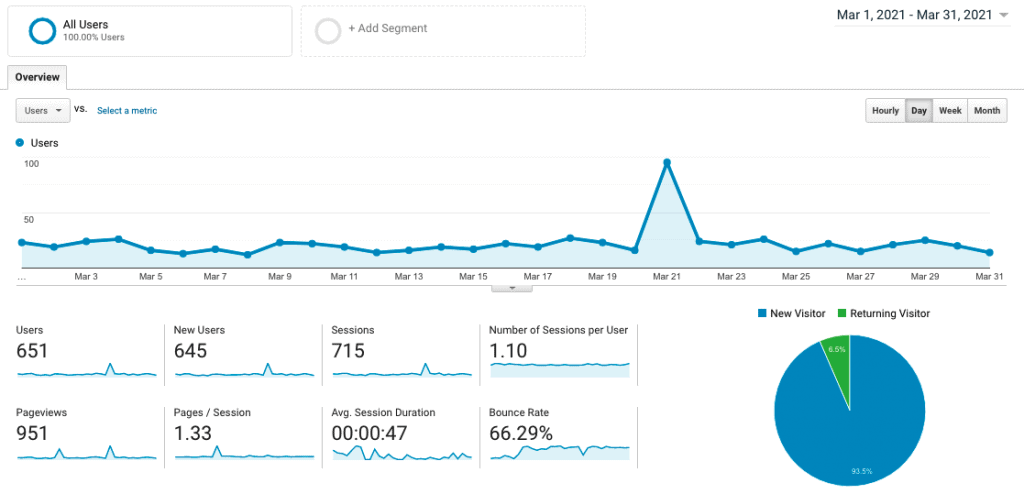
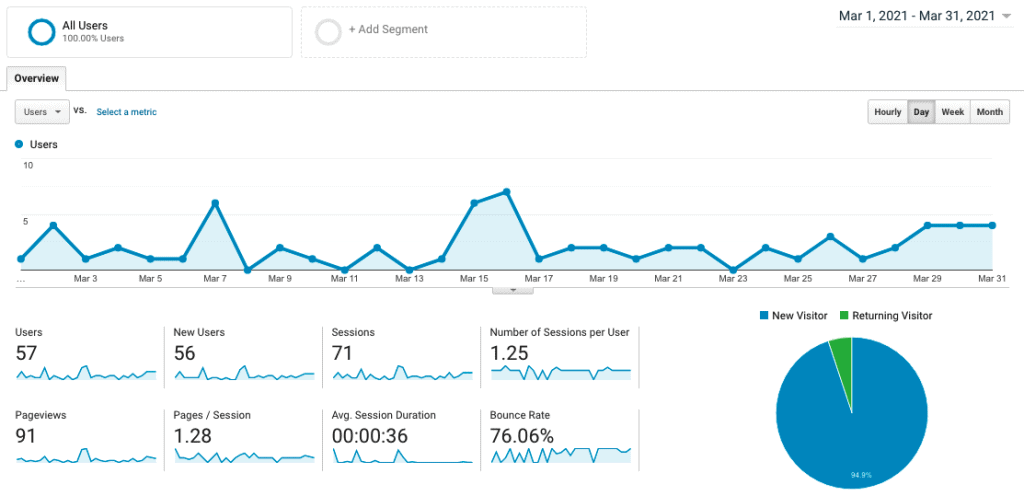
Site 3 also had bot traffic which screwed with stats like average session duration and bounce rate. Otherwise, the traffic is consistently just average, not moving up or down drastically.
Site 3 Amazon Affiliate Earnings
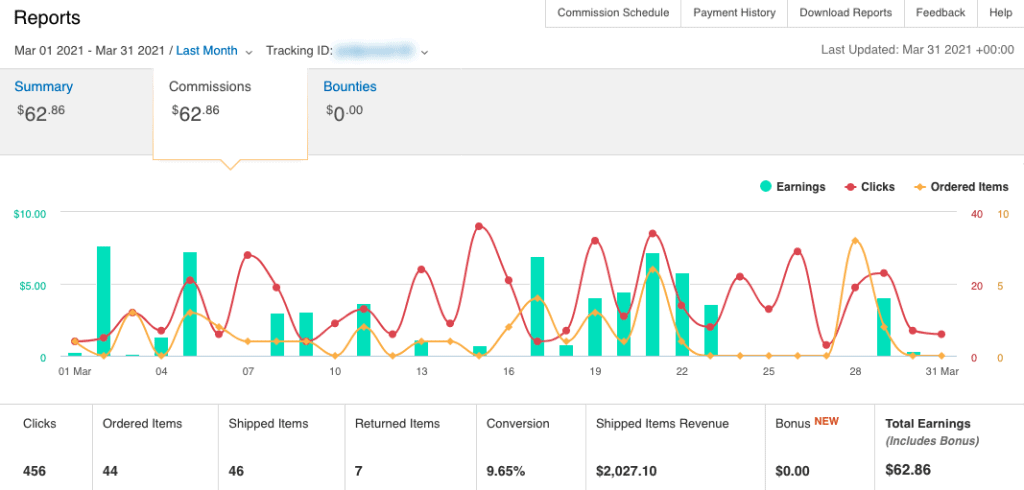
Amazon Affiliate sales bounced back up from February’s $10.60, so that was good. A good few days at the end of March with no sales, but still received clicks.
Site 3 Ezoic Earnings
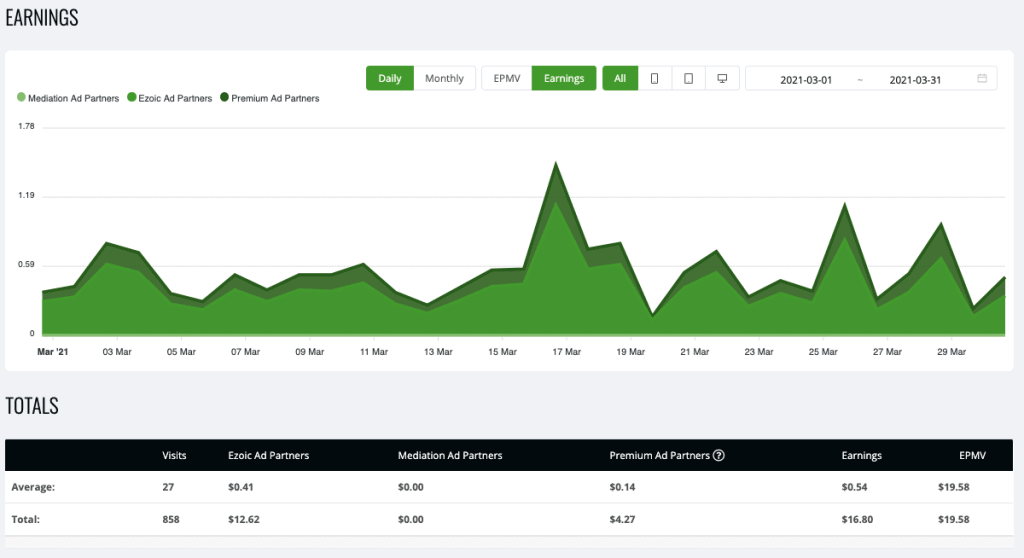
Ezoic earnings was $16.80 with an EPMV of $19.58. It’s not a bad EPMV and Site 3’s niche gives a slightly better EPMV than Site 2, so I do want to increase traffic here.
Site 3 Expenses
Expenses were just $7.55 as it was just hosting and its share of Ezoic costs for Premium ads.
Little-by-little chipping away to get to breakeven on the site. Overall, Site 3 is in the hole for -$395.68.
Site 3 Plan For March
Re-optimize the content with Frase and keep an eye on any positive or negative effects from removing the 301 redirect from the expired domain.
Site 4 – New Site in 2021
Not too much going on with the site just yet, but it’s starting to get search impressions and ranking in the Top 10 for a few keywords.
11 articles were published in March, mostly in the second half of the month, for total of 28 articles. 17 of those are buyer intent articles and 11 are informational. Here’s the breakdown of how many articles were published each month:
- January: 3 articles
- February: 14
- March: 11
Here is the Google Analytics. It’s been getting a little traffic from Google search, social media, and other search engines.
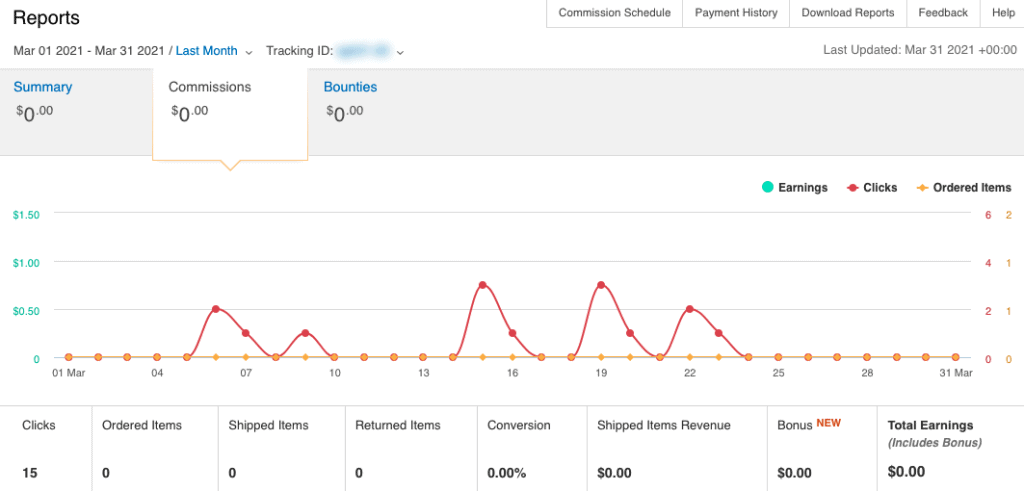
Still no sales on Amazon Associates or other affiliate programs in March. I don’t expect to really earn anything for a couple more months at least, unless I get lucky.
Even though there’s the odd click here and there that goes to the product pages, the odds are tiny there’ll be a sale.
Final Thoughts
Next month’s income report will be more interesting after the Google Update. We’ll see how the month ends up, but it’s Site 1 traffic and earnings have declined significantly. Position ranking drops weren’t drastic, but they were enough that traffic took a hit, which has hit earnings too.
Don’t forget to sign up for the Niche Surfer newsletter at NicheSurfer.com that’s sent out every Saturday at 9:00am Eastern Standard Time in the US. Each week, I send actionable links and resources to help you on your affiliate marketing journey.